Riepilogo
AiroCollect funziona come segue:
- Voli con un drone sull’area che desideri scansionare (5-10 minuti).
- Carichi le immagini su collect.airobot.eu.
- Dopo l’elaborazione, riceverai un’e-mail (30 minuti in media)
- Vai e prendi tutte le misurazioni/esportazioni di cui hai bisogno
Di seguito troverai istruzioni dettagliate su come iniziare, utilizzare il software e gestire il tuo abbonamento e i pagamenti.
L’obiettivo è farti massimizzare i profitti con AiroCollect.
Dimostrazione
La demo del tetto illustra le potenziali prestazioni di AiroCollect nella misurazione dei tetti per presentare offerte ai tuoi clienti.
La demo solare illustra le potenziali prestazioni di AiroCollect per simulare progetti solari offerti ai tuoi clienti.
La demo del preventivo spiega le potenziali prestazioni di AiroCollect nel creare offerte di progetto per i tuoi clienti.
La demo del preventivo spiega le potenziali prestazioni di AiroCollect nel creare offerte di progetto per i tuoi clienti.
Introduzione
AiroCollect è un’applicazione basata sul cloud:
- Il software è accessibile ovunque ci sia internet
- Memorizziamo tutto per te, niente più pulsanti di salvataggio
- Hai sempre l’ultima versione, niente più aggiornamenti
Tutto quello che devi fare è configurare il tuo drone e volare per effettuare tutte le misurazioni necessarie.
Configurazione del sistema
Prendi il volo
Volare
AiroCollect funziona con qualsiasi drone che acquisisca immagini con posizione GPS:
- Si vola con il drone sopra l’oggetto che si desidera digitalizzare.
- Mentre sorvoli, lasci che il drone scatti delle immagini.
- Ogni immagine dovrebbe contenere almeno il 70% dell’immagine precedente.
- Ogni immagine dovrebbe contenere una parte del contesto ambientale.
- In media una scansione varia tra 50 e 250 immagini
- Per scansioni di terreni di grandi dimensioni il sistema può gestire fino a 1.500 immagini
Di seguito troverete alcune spiegazioni su come far volare e iniziare ad assemblare il vostro modello.
Misura
AiroCollect offre numerose opzioni di misurazione:
Strumenti 2D
- distanza
- superficie
- immagini
- cerchi
- note
- struttura
- confrontare
Strumenti 3D
- distanza
- zona
- altezza
- angoli
- note
- volumi
- profili di altezza
- punti di riferimento
Strumenti solari
- Pannelli 2D e 3D
- azimut
- angolo del pannello verticale
- potenza totale dell'impianto
- ritratto - paesaggio
- orientamento (N-S, E-W)
- spaziatura automatica dei pannelli
- superficie di riempimento automatico
- rilevamento degli ostacoli nel riempimento
Accuratezza
Il nostro software è molto flessibile riguardo al drone che utilizzi ed è anche eccezionalmente accurato. In media la scala è accurata al 99%. Dimostrato di essere più che sufficiente per preventivi, preparazione del lavoro e fatturazione.
Se si desidera una accuratezza reale verificata, è possibile scalare fino a una misurazione esatta effettuata o utilizzare un piano di riferimento autodefinito. L’uso di un drone con correzione RTK prevede lo stesso. Con una di queste attenuazioni, i dati sono inoltre utili per una progettazione accurata e un catasto.
Precisione
Che si tratti di misurare volumi, superfici, distanze o elevazioni, Airocollect fornisce misurazioni con precisione fino al centimetro, consentendoti di utilizzare i punti geografici in modo semplice e accurato.
Le misurazioni possono essere prese in sistema metrico o imperiale.
Classificazione
Le classificazioni contengono un’etichetta e un colore autodefiniti per aiutare nel riepilogo delle misurazioni effettuate.
- Conciatetti ottengono una panoramica immediata della superficie totale delle tegole, delle impalcature o della distanza totale di colmi e grondaie e molto altro ancora.
- I giardinieri ottengono la superficie totale, ad esempio, dall’erba o dal marciapiede, il volume totale del terreno da spostare o i cespugli da rimuovere o il numero totale di irrigatori da installare,…
- In genere è possibile utilizzarli per ottenere l’inventario periodico delle pile di scorte o tutti gli altri diversi tipi di misurazioni aggregate.
In totale è possibile configurare 30 classificazioni autodefinite.
Utilizzare il software
Spazio di lavoro
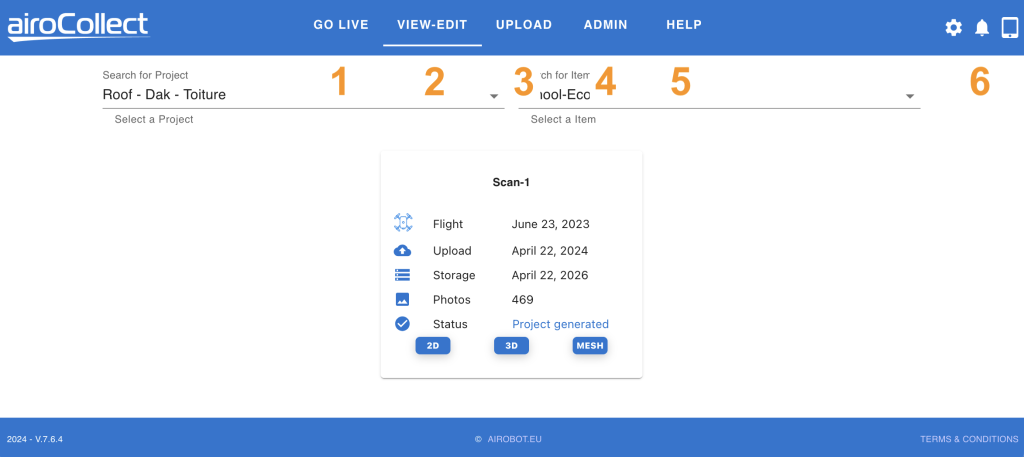
1. Vai in diretta
Funzioni per comandare il drone dall’ufficio.
2. Visualizza - Modifica
Visualizza i tuoi progetti scansionati
- Selezionare il progetto cliccando sulla freccia o digitando parte del nome del progetto.
- Selezionare l’elemento cliccando sulla freccia o digitando parte del nome dell’elemento.
- Seleziona la scansione su cui vuoi lavorare.
3. Carica
- Seleziona il progetto e l’elemento in cui desideri caricare un progetto.
– Se il progetto e l’elemento non esistono, fare clic sul pulsante +.
– Una volta cliccato il pulsante +, convalidare con v o annullare con xSe hai lavorato nella stessa area, carica sotto lo stesso progetto e articolo! Ciò consentirà di confrontare i modelli e di avere le misurazioni del tetto e della facciata nella stessa posizione.
Fare clic su AVANTI per continuare.
- Seleziona il tipo di scansione effettuata per un funzionamento ottimale dell’algoritmo.
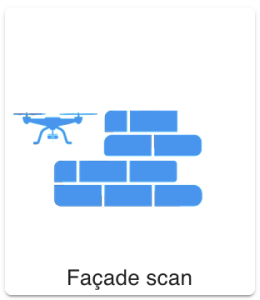
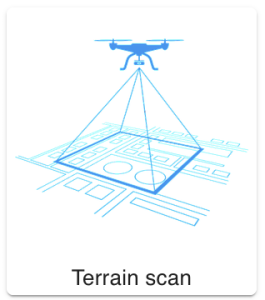
– Con TERRAIN otterrai un’ortofoto 2D (immagine satellitare)
– Con TERRAIN otterrai un pointcloud 3D e una mesh (3D fotorealistico)
– Con FACADE otterrai un pointcloud 3D e una meshOra scegli un nome per la scansione che stai per effettuare e premi Avanti.
- Premi “Aggiungi altri file” per aprire uno strumento di ricerca file oppure trascina e rilascia le immagini scattate dal drone in questa finestra.
– Per un funzionamento più rapido, copia prima le immagini dal tuo drone al tuo PC.
– Selezionare solo immagini di una singola area e di un momento simile.
– Escludere le immagini a terra.
– Includere solo immagini con aria su di esse nelle scansioni “Facciata”Il software verificherà se le immagini sono conformi ad alcune delle best practice per generare un modello utilizzabile. Per alcune regole il caricamento verrà bloccato, per altre riceverai un avviso che il risultato varia.
Se un’immagine non è conforme, dovresti rimuoverla dall’elenco.
- Il passaggio finale mostra il sistema di coordinate in cui verranno elaborate le immagini. Questo è importante se si desidera eseguire un passaggio di rettifica aggiungendo punti di controllo a terra o se si desidera acquisire immagini con la posizione GPS RTK.
4. Amministratore
- Azienda
– Aggiungi il logo aziendale per il report.
– Aggiungi i dettagli aziendali per il report. - Utenti
– Gestisci utenti, menu e accesso ai dati. - Progetti
– Modifica nome e dettagli del progetto. - Set di dati
– Panoramica e opzione di eliminazione per le scansioni. - WMS
– Aggiungi e modifica più potenziali sfondi diversi per 2D.
– Es. Catasto, modelli di elevazione, dati demografici. - Sistema di coordinate
– Definisci i sistemi di coordinate predefiniti per i voli GPS e RTK-GPS
– Definisci il sistema di coordinate predefinito per le esportazioni
– Passaggio da metrico a imperiale - Classificazioni
– Modifica gli aggregati di colore in base ai quali vengono categorizzate le misurazioni. - Licenze
– Guarda in quale programma ti trovi e quante scansioni ti restano. - Droni
– Guarda quali droni non possono essere utilizzati con la funzionalità AiroLive.
5. Aiuto
Collegamento a questa pagina.
6. Modalità
- Lingua
- Modalità oscura
- Cambiare la password
- Esci
- Notifiche
- Modalità tablet/desktop
Ambiente 2D
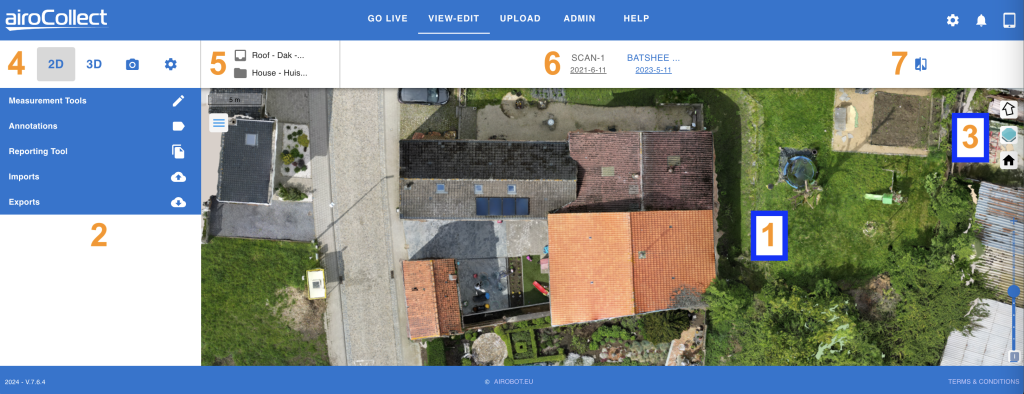
1. Navigazione ortogonale
(funziona anche durante la misurazione)
Traduci (muoviti su, giù, sinistra destra)
1. Fai clic e tieni premuto il pulsante sinistro del mouse
2. Trascina il puntatore del mouse sullo schermo
3. Rilascia per mantenere la posizione corrente
Ruota (sposta l’immagine in una nuova posizione orizzontale)
1. Premi MAIUSC sulla tastiera e tieni premuto
2. Fai clic + tieni premuto il tasto sinistro del mouse
3. Trascina il puntatore del mouse sullo schermo per ruotare
4. Rilascia per mantenere la posizione corrente
Zoom (ingrandisci o rimpicciolisci ciò che vedi)
1. Usa lo scorrimento del mouse verso l’alto per ingrandire
2. Usa lo scorrimento del mouse verso il basso per ridurre
2. Strumenti
Ci sono diversi strumenti che puoi usare per ottenere informazioni utili dalla foto ortografica. Questi sono spiegati più avanti:
- Strumenti di misurazione: prendi le misure
- Annotazioni: Mostra le misure prese
- Genera un report PDF
- Importa un file CAD
- Esportazione file CAD, foto ortografica (con coordinate), DEM
3. Mappa
Home Point (torna alla posizione iniziale)
1. Clicca sull’icona della casa
Livelli (visualizza sfondi diversi)
1. Livelli WMS ospitati pubblicamente
2. Livelli WMS ospitati privatamente
3. Sfondo nero
4. Sfondo bianco
Freccia Nord (per solare)
1. Clicca per puntare verso Nord
4. Modalità
Selezione del set di dati
Ambiente 2D
– Visualizza orto, immagine satellitare
Ambiente 3D
– Visualizza il modello in 3D
Immagini
– Rivedi tutte le immagini caricate
Impostazioni
– Qui puoi trovare i riferimenti della scansione
– Qui puoi trovare i link al modello da condividere online.
5. Nome
a) Nome del progetto
b) Nome dell’articolo
6. Scansioni
Seleziona e visualizza le diverse scansioni effettuate nell’ambito di questo progetto e di questo elemento.
7. Confronta
È possibile confrontare tra loro diverse ortofoto.
Seleziona come vuoi utilizzare il sistema di confronto:
– Confronta 2 set di dati tra loro
– Confronta un set di dati con un layer WMS (ad esempio Catasto)
Ideale per il follow-up del progetto o per il confronto dei dati catastali.
Misurazioni 2D
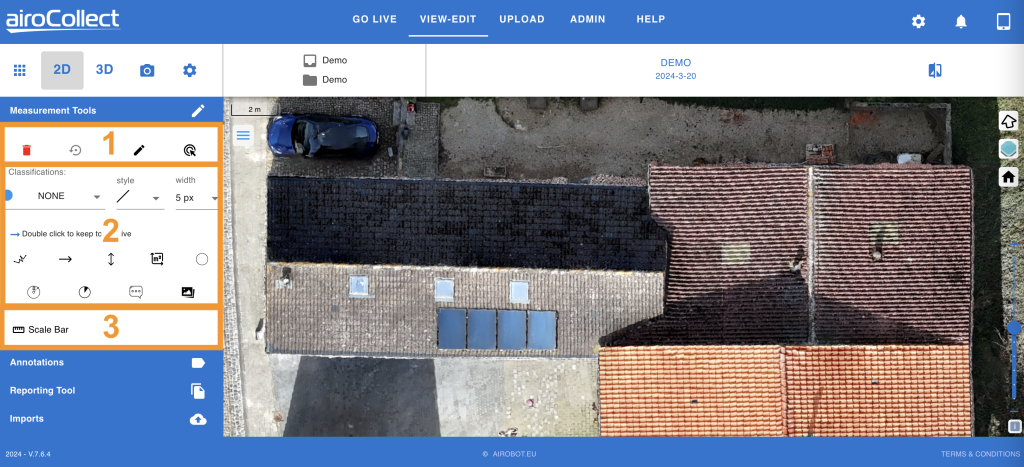
1. Stato dello schermo
Reimposta
Fai clic a sinistra e convalida per ricominciare
Annulla
Fai clic a sinistra per ripristinare l’ultima misurazione effettuata
Modifica
Metti lo schermo in modalità modifica, in modo da poter andare nella foto orto e modificare le misurazioni inserite
Elimina
Attiva una modalità di eliminazione, cliccando a sinistra su una misurazione la eliminerai.
2. Strumenti di misurazione
Scegli una classificazione
1. Fare clic a sinistra e selezionare un’etichetta e un colore per la misurazione che si desidera effettuare.
I nomi e i colori possono essere modificati nella sezione “admin”
Le misurazioni effettuate in una classificazione verranno raggruppate per la modifica e la segnalazione in seguito.
Attiva uno strumento di misurazione
1. SSeleziona lo strumento che vuoi usare.
– Fai clic una volta a sinistra per usare lo strumento una volta
– Fai clic due volte a sinistra per usare lo strumento in modo continuo
Passare sopra la foto ortografica per avviare la misurazione.
1. In base alla classificazione scelta, hai un punto colorato collegato al puntatore del mouse.
2. Fai clic una volta a sinistra per iniziare una misurazione.
3. Fai clic di nuovo a sinistra per un punto intermedio, se necessario.
4. Fai clic due volte a sinistra per terminare la misurazione.
Puoi trovare le tue misure nelle annotazioni sotto la classificazione scelta.
3. Barra della scala
Aggiungere una misurazione di riferimento al modello
1. Fare clic a sinistra per attivare il posizionamento della misurazione di riferimento.
2. Posizionare una misurazione di riferimento sulla foto ortografica, 1 clic a sinistra per iniziare, 2 clic a sinistra per terminare
3. Modificare il valore nel valore desiderato
4. Tutte le altre misurazioni saranno rettificate con la misurazione di riferimento presa.
Annotazioni 2D
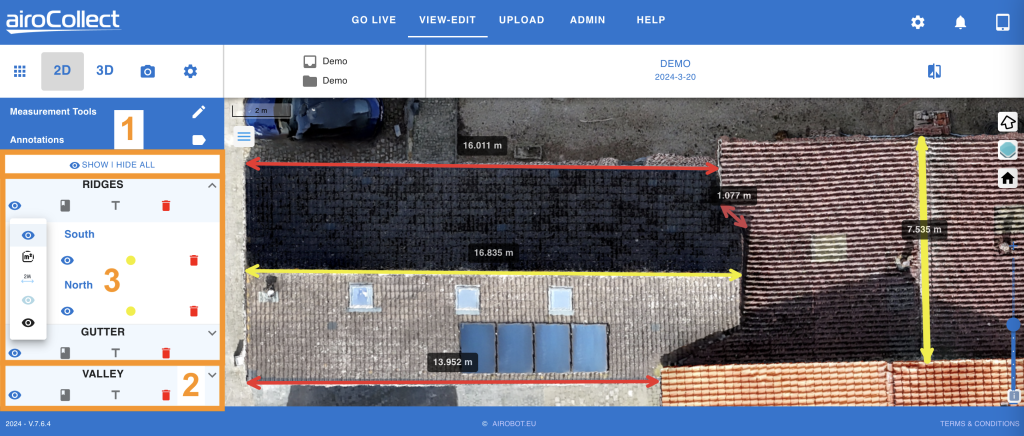
1. Mostra/Nascondi tutto
Fare clic su mostra/nascondi tutto per passare rapidamente dalla visualizzazione di tutte le annotazioni a quella di nessuna.
2. Livello di classificazione
Mostra i dettagli della classificazione
1. Fare clic a sinistra sulla freccia accanto al titolo di una classificazione per aprirla.
Visualizzazione della classificazione
1. Fai clic a sinistra sull’occhio per vedere le opzioni di visualizzazione della classificazione:
– Blu scuro: Mostra tutto
– m2: Mostra linee e superfici
– m: Mostra linee e distanze
– Azzurro: Mostra solo linee
– Nero: Nascondi
Etichetta di classificazione
1. Fare clic a sinistra per mostrare/nascondere l’etichetta di classificazione sulla foto ortografica.
Etichetta di misurazione
1. Fare clic a sinistra per mostrare/nascondere l’etichetta di misurazione sulla foto ortografica.
Bidone della spazzatura
1. Fare clic a sinistra e convalidare l’eliminazione di tutte le misurazioni di 1 classificazione.
3. Misure di classificazione
Modifica il nome
1. Fare clic a sinistra sulla matita per modificare
Cambia la vista
1. Clicca a sinistra sull’occhio per cambiare il modo in cui viene visualizzata la misurazione. Lo stesso vale per il layer di classificazione.
Cambia la classificazione
1. Fare clic con il tasto sinistro del mouse sul punto colorato per modificare la classificazione della misurazione.
Elimina la misurazione
1. Fare clic con il tasto sinistro del mouse sul cestino e convalidare per rimuovere la misurazione.
Strumento di reporting 2D
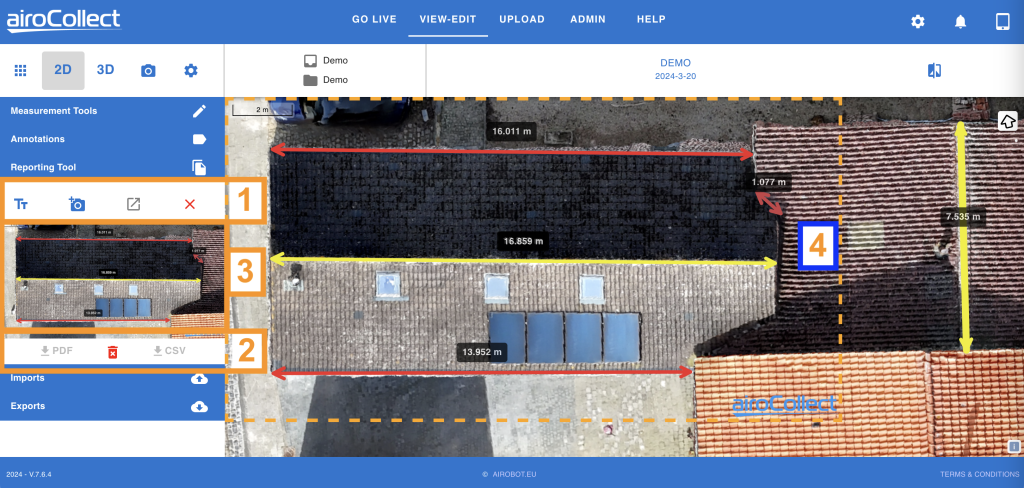
1. Creare funzioni
Tt
1. Fai clic a sinistra per aprire un popup e aggiungere un testo generico a ogni screenshot acquisito.
Telecamera
1. Fai clic a sinistra su camera+ per ottenere un rettangolo tratteggiato.
2. Sposta l’immagine all’interno del rettangolo per ottenere la vista corretta.
3. Fai clic a sinistra la seconda volta per acquisire lo screenshot.
4. Premi la croce a destra per annullare.
Genera rapporto
1. Fare clic con il tasto sinistro del mouse su Genera report per generare il report.
2. Scarica ed elimina
Scarica PDF
1. Fare clic con il tasto sinistro del mouse sul pulsante Scarica PDF per ottenere il report.
Scarica CSV
1. Fare clic con il tasto sinistro del mouse sul pulsante Scarica csv per ottenere le misurazioni in formato foglio
Bidone della spazzatura
1. Fare clic con il tasto sinistro del mouse su un cestino della spazzatura per eliminare l’immagine visualizzata.
3. Schermate
Schermati
Premi le frecce, in caso di più screenshot, per mostrare lo screenshot acquisito.
Visualizza una miniatura dello screenshot.
4. Schema dello screenshot
1. La linea tratteggiata descrive cosa verrà posizionato come immagine nel report.
2. Con la linea tratteggiata attiva puoi comunque ingrandire e ruotare la foto ortografica.
3. L’obiettivo è ottenere la migliore visualizzazione di ciò che vuoi mostrare al tuo cliente in questo rettangolo.
Importazioni ed esportazioni 2D
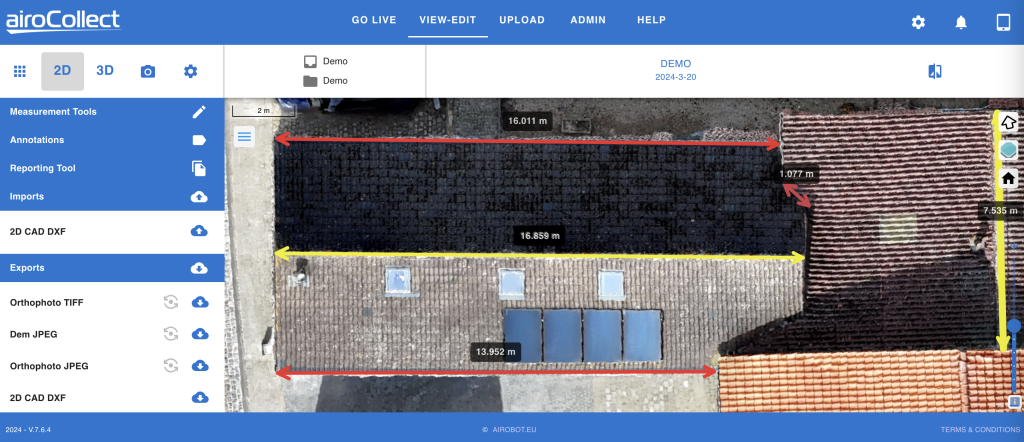
1. Importazioni
Carica un file CAD 2D georeferenziato come sovrapposizione della tua foto ortografica
2. Esportazioni
1. La foto ortografica in formato TIFF, inclusi i file di riferimento geografico.
2. Il DEM (modello digitale di elevazione)
3. La foto ortografica in formato JPG, inclusi i file di riferimento geografico.
4. Le misure disegnate come linee in un formato DXF.
Ambiente 3D
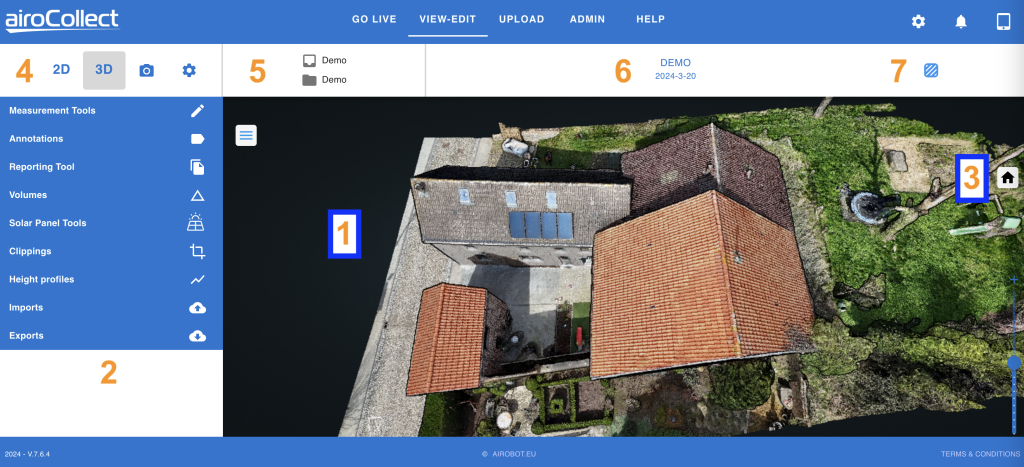
1. Navigazione
(funziona anche durante la misurazione)
Traduci (muoviti su, giù, sinistra destra)
1. Fai clic seguito da Fai clic e tieni premuto il tasto sinistro del mouse
2. Trascina il puntatore del mouse sullo schermo
3. Rilascia per mantenere la posizione corrente
Ruota (sposta l’immagine in una nuova posizione orizzontale)
1. Fai clic e tieni premuto il pulsante sinistro del mouse
2. Trascina il puntatore del mouse sullo schermo per ruotare
3. Rilascia per mantenere la posizione corrente
Zoom (ingrandisci o rimpicciolisci ciò che vedi)
1. Utilizzare lo scorrimento del mouse verso l’alto per ingrandire
2. Utilizzare lo scorrimento del mouse verso il basso per ridurre
2. Strumenti
Ci sono diversi strumenti che puoi usare per ottenere informazioni utili dalla foto ortografica. Questi sono spiegati più avanti:
- Strumenti di misurazione: prendi le misure
- Annotazioni: Mostra le misure prese
- Strumento di reporting: genera un report PDF
- Volumi: Misurazione del volume
- Strumenti per pannelli solari: simula i pannelli solari.
- Ritagli: crea ritagli di nuvole di punti per l’esportazione e la visualizzazione
- Profili di altezza: Genera profilo di altezza
- Importazioni: Importazione di progetti CAD
- Esportazioni: DAE, LAS, OBJ, e57, DXF
3. Casa
Home Point (torna alla posizione iniziale)
1. Clicca sull’icona della casa
4. Modalità
Selezione del set di dati
Ambiente 2D
– Visualizza ortogonale, Immagine satellitare
Ambiente 3D
– Visualizza il modello in 3D
Immagini
– Rivedi tutte le immagini caricate
Impostazioni
– Qui puoi trovare i riferimenti della scansione
– Qui puoi trovare i link al modello da condividere online.
5. Nome
a) Nome del progetto
b) Nome dell’articolo
6. Scansioni
Seleziona e visualizza le diverse scansioni effettuate nell’ambito di questo progetto e di questo elemento.
7. Maglia
Passare da una nuvola di punti a un’immagine fotorealistica
Misurazioni 3D
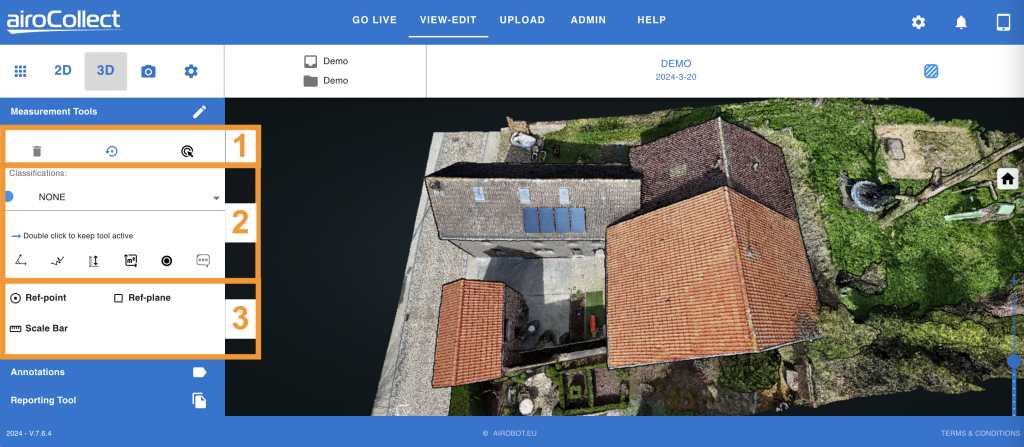
1. Stato dello schermo
Reimposta
Fai clic a sinistra e convalida per ricominciare
Annulla
Fai clic a sinistra per ripristinare l’ultima misurazione effettuata
Elimina
Attiva una modalità di eliminazione, cliccando a sinistra su una misurazione la eliminerai.
2. Strumenti di misurazione
Scegli una classificazione
1. Fare clic a sinistra e selezionare un’etichetta e un colore per la misurazione che si desidera effettuare.
I nomi e i colori possono essere modificati nella sezione “admin”
Le misurazioni effettuate in una classificazione verranno raggruppate per la modifica e la segnalazione in seguito.
Attiva uno strumento di misurazione
1. SSeleziona lo strumento che vuoi usare.
– Fai clic una volta a sinistra per usare lo strumento una volta
– Fai clic due volte a sinistra per usare lo strumento in modo continuo
Passare sopra la foto ortografica per avviare la misurazione.
1. In base alla classificazione scelta, hai un punto colorato collegato al puntatore del mouse.
2. Fai clic una volta a sinistra per iniziare una misurazione.
3. Fai clic di nuovo a sinistra per un punto intermedio, se necessario.
4. Fai clic due volte a sinistra per terminare la misurazione.
Puoi trovare le tue misure nelle annotazioni sotto la classificazione scelta.
3. Punto di riferimento, piano e scala
Aggiungi un punto di riferimento
1. Fai clic a sinistra per attivare il posizionamento del punto di riferimento.
2. Fai clic a sinistra per posizionare un punto di riferimento nel modello 3D.
3. Tutti i punti di altezza saranno spostati verso questo punto di riferimento.
4. I profili di altezza sono spostati verso questo punto di riferimento.
Aggiungi un piano di riferimento
1. Fai clic a sinistra per attivare il posizionamento del piano di riferimento.
2. Posiziona 3 punti sul modello 3D, fai clic a sinistra per posizionare un punto.
3. Posiziona i punti distanti e non in linea per avere il piano meglio definito.
4. Tutte le misurazioni dell’altezza saranno prese ortogonalmente al piano.
Aggiungi una misurazione di riferimento
1. Fare clic a sinistra per attivare il posizionamento della misurazione di riferimento.
2. Posizionare una misurazione di riferimento sul modello 3D, 1 clic a sinistra per iniziare, 2 clic a sinistra per terminare
3. Modificare il valore nel valore desiderato
4. Tutte le altre misurazioni saranno rettificate con la misurazione di riferimento presa.
Annotazioni 3D
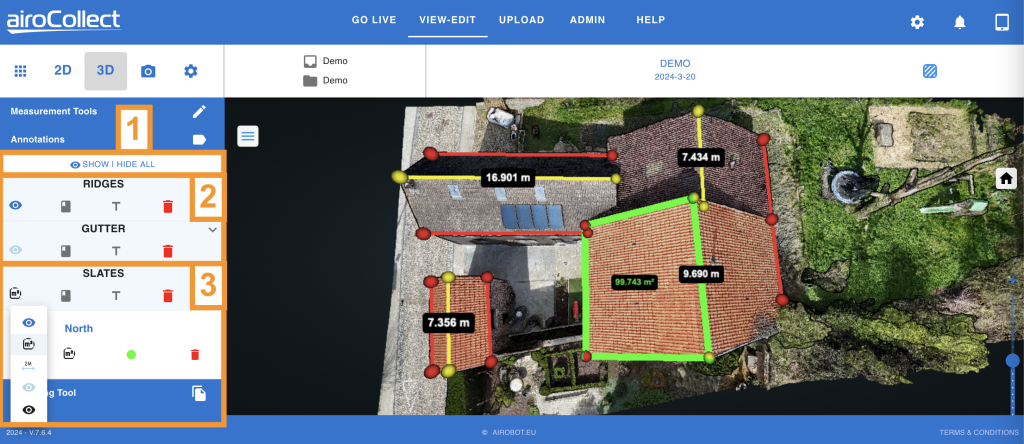
1. Mostra/Nascondi tutto
Fare clic su mostra/nascondi tutto per passare rapidamente dalla visualizzazione di tutte le annotazioni a quella di nessuna.
2. Livello di classificazione
Mostra i dettagli della classificazione
1. Fare clic a sinistra sulla freccia accanto al titolo di una classificazione per aprirla.
Visualizzazione della classificazione
1. Fai clic a sinistra sull’occhio per vedere le opzioni di visualizzazione della classificazione:
– Blu scuro: Mostra tutto
– m2: Mostra linee e superfici
– m: Mostra linee e distanze
– Azzurro: Mostra solo linee
– Nero: Nascondi
Etichetta di classificazione
1. Fare clic a sinistra per mostrare/nascondere l’etichetta di classificazione sul modello 3D.
Etichetta di misurazione
1. Fare clic a sinistra per mostrare/nascondere l’etichetta di misurazione sul modello 3D.
Bidone della spazzatura
1. Fare clic a sinistra e convalidare l’eliminazione di tutte le misurazioni di 1 classificazione.
3. Misure di classificazione
Modifica il nome
1. Fare clic a sinistra sulla matita per modificare
Cambia la vista
1. Clicca a sinistra sull’occhio per cambiare il modo in cui viene visualizzata la misurazione. Lo stesso vale per il layer di classificazione.
Cambia la classificazione
1. Fare clic con il tasto sinistro del mouse sul punto colorato per modificare la classificazione della misurazione.
Elimina la misurazione
1. Fare clic con il tasto sinistro del mouse sul cestino e convalidare per rimuovere la misurazione.
Strumento di reporting 3D
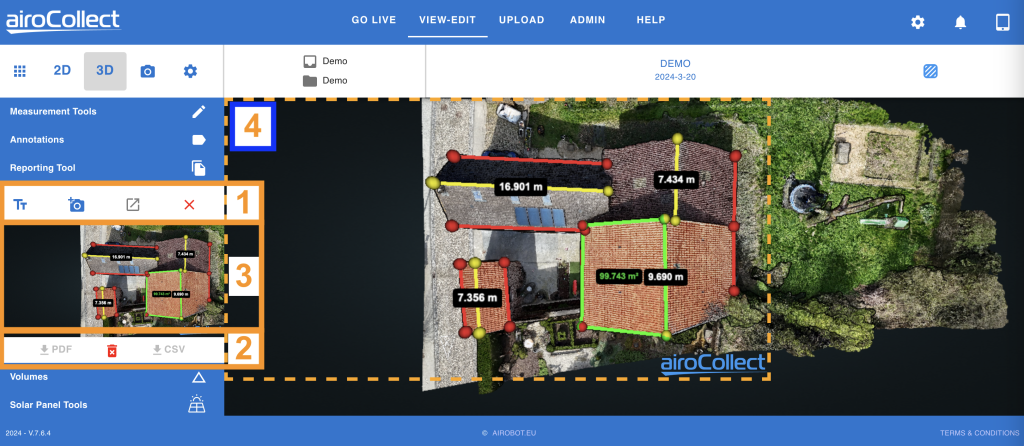
1. Creare funzioni
1. Tt –> Fai clic a sinistra per aprire un popup e aggiungere un testo generico a ogni screenshot acquisito.
2. Fotocamera:
– Fai clic a sinistra su camera+ per ottenere un rettangolo tratteggiato.
– Sposta l’immagine all’interno del rettangolo per ottenere la vista corretta.
– Fai clic a sinistra la seconda volta per acquisire lo screenshot.
– Premi la croce a destra per annullare.
3. Genera report
– Fai clic a sinistra su Genera report per generare il report.
2. Scarica ed elimina
Scarica PDF
1. Fare clic con il tasto sinistro del mouse sul pulsante Scarica PDF per ottenere il report.
Scarica CSV
1. Fare clic con il tasto sinistro del mouse sul pulsante Scarica csv per ottenere le misurazioni in formato foglio
Bidone della spazzatura
1. Fare clic con il tasto sinistro del mouse su un cestino della spazzatura per eliminare l’immagine visualizzata.
3. Schermate
Schermati
Premi le frecce, in caso di più screenshot, per mostrare lo screenshot acquisito.
Visualizza una miniatura dello screenshot.
4. Schema dello screenshot
1. La linea tratteggiata descrive cosa verrà posizionato come immagine nel report.
2. Con la linea tratteggiata attiva puoi comunque ingrandire e ruotare la foto ortografica.
3. L’obiettivo è ottenere la migliore visualizzazione di ciò che vuoi mostrare al tuo cliente in questo rettangolo.
Volumi 3D
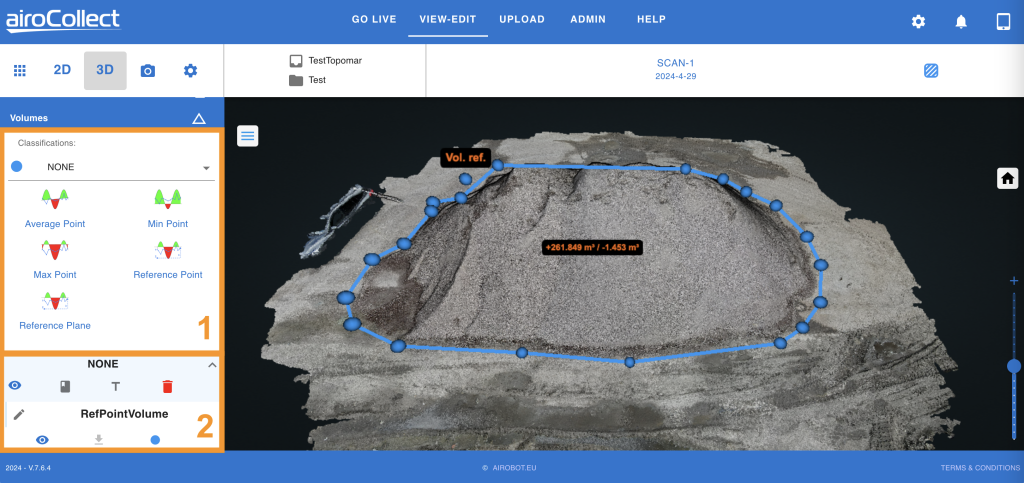
Generale
Lo strumento volume può essere utilizzato per misurare cumuli e pozzi. Ottieni il volume positivo e negativo, misurato verticalmente sopra e sotto la superficie:
– La superficie può essere definita scegliendo tra le 5 opzioni disponibili.
– Una volta definito un poligono di contorno, questo viene proiettato verticalmente su questa superficie.
– Il volume è il volume totale dalla superficie al primo punto trovato sopra o sotto.
– Questo verticalmente all’interno del confine del poligono proiettato.
1. Strumenti
1. Fai clic a sinistra su un’icona del volume per attivare l’opzione.
2. Entra nel modello e traccia un poligono attorno al volume da misurare.
3. Nel modello fai clic una volta a sinistra per iniziare il poligono e per ogni punto.
4. Fai clic due volte a sinistra per terminare il poligono.
5. In base all’opzione scelta, il punto successivo è un punto di riferimento o un posizionamento del piano.
Punto medio
La superficie è il piano di avvicinamento migliore definito dal poligono posizionato.
Una volta posizionato il poligono, il volume viene calcolato automaticamente.
Punto minimo
La superficie è il piano orizzontale che passa per il punto più basso del poligono disegnato.
Una volta posizionato il poligono, il volume viene calcolato automaticamente da questo punto di riferimento più basso.
Punto massimo
La superficie è il piano orizzontale che passa per il punto più alto del poligono disegnato.
Una volta posizionato il poligono, il volume viene calcolato automaticamente da questo punto di riferimento più alto.
Punto di riferimento
La superficie è il piano orizzontale passante per un punto di riferimento posizionato manualmente sul modello.
Una volta posizionato il poligono, il volume viene calcolato dopo aver posizionato il punto di riferimento.
Piano di riferimento
La superficie è il piano definito da te tramite il posizionamento di 3 punti di riferimento sul modello.
Una volta posizionato il poligono, il volume viene calcolato dopo aver posizionato i 3 punti che definiscono il piano di riferimento.
2. Annotazioni
Mostra i dettagli della classificazione
Fare clic sulla freccia sinistra accanto al titolo di una classificazione per aprirla.
Scarica nuvola di punti di volume
Fare clic con il tasto sinistro del mouse sulla freccia di download di un volume per scaricarlo.
Visualizzazione della classificazione o misurazione
Clicca a sinistra sull’occhio per vedere le opzioni di visualizzazione della classificazione:
– Blu scuro: Mostra tutto
– Azzurro: Mostra solo le linee
– Nero: Nascondi
Modificare il nome della misurazione
Fare clic con il tasto sinistro del mouse sulla matita a sinistra del nome della misurazione
Etichetta di classificazione o misurazione
Fare clic a sinistra per mostrare/nascondere l’etichetta di classificazione sul modello 3D.
Bidone della spazzatura
Fare clic a sinistra e convalidare l’eliminazione di tutte le misurazioni di 1 classificazione.
Ritagli 3D
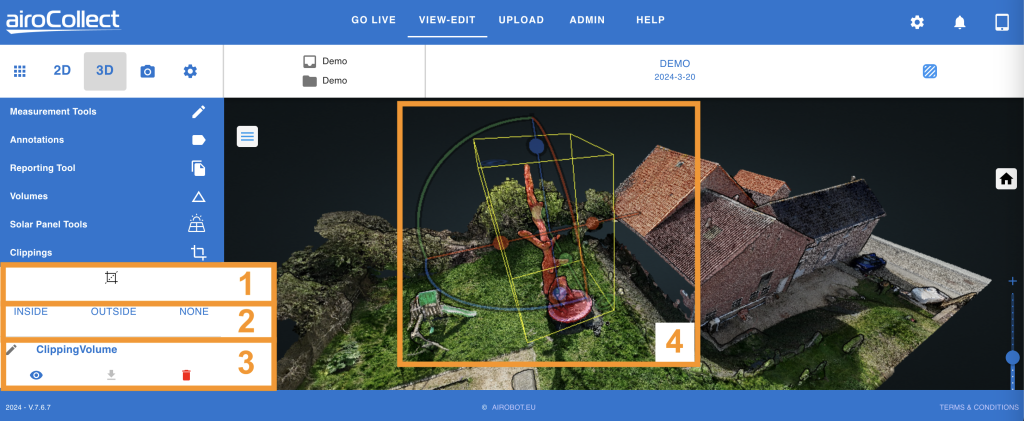
1. Crea
1. Fai clic a sinistra sull’icona quadrata per attivare lo strumento di ritaglio.
2. Spostati sul modello per posizionare la casella di ritaglio.
3. Fai clic a sinistra per posizionare la casella di ritaglio sul modello.
4. Fai clic a sinistra nella casella per modificarla.
2. Modalità
1. Seleziona interno per mostrare solo ciò che si trova all’interno del ritaglio.
2. Seleziona esterno per nascondere il contenuto del ritaglio dal modello.
3. Seleziona nessuno per mostrare il ritaglio come una nuvola di punti di colore diverso.
3. Annotazioni
Matita
Fare clic con il tasto sinistro del mouse sulla matita per modificare il nome del ritaglio.
Occhio
Fare clic con il tasto sinistro del mouse sull’occhio per modificare la visualizzazione del ritaglio.
Scarica freccia
Fare clic a sinistra per scaricare il ritaglio come nuvola di punti.
Bidone della spazzatura
Fare clic a sinistra e confermare per eliminare il ritaglio.
4. Clip
Ruotare
Fai clic a sinistra e tieni premuto su una linea curva. Scorri per ruotare la casella lungo quella linea curva.
Tradurre
Fai clic a sinistra e tieni premuto su una linea retta. Scorri per far scorrere la casella lungo quella linea.
Espandere
Fai clic a sinistra e tieni premuto su un punto elenco. Scorri per espandere la casella lungo quella linea di punti elenco.
Profili di altezza 3D
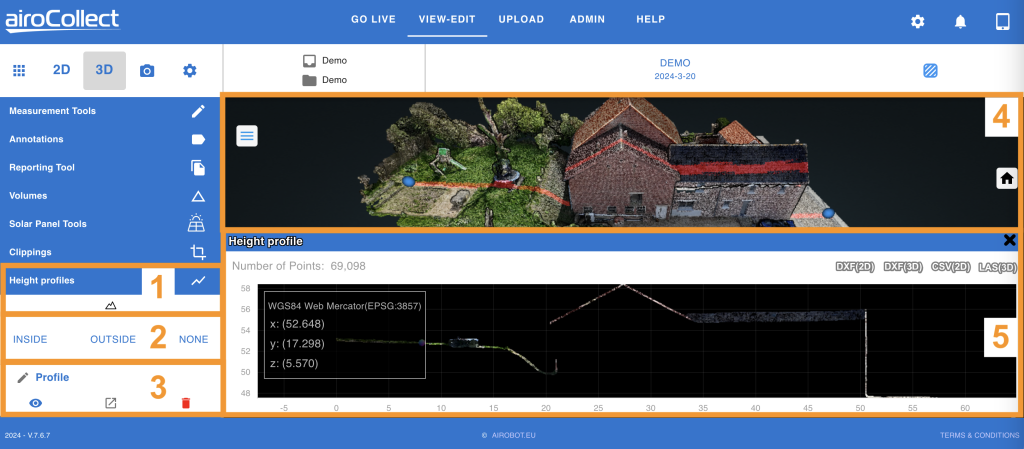
1. Crea
1. Fai clic a sinistra sull’icona quadrata per attivare lo strumento di ritaglio.
2. Spostati sul modello per posizionare la casella di ritaglio.
3. Fai clic a sinistra per posizionare la casella di ritaglio sul modello.
4. Fai clic a sinistra nella casella per modificarla.
2. Modalità
1. Seleziona interno per mostrare solo ciò che si trova all’interno del ritaglio.
2. Seleziona esterno per nascondere il contenuto del ritaglio dal modello.
3. Seleziona nessuno per mostrare il ritaglio come una nuvola di punti di colore diverso.
3. Annotazioni
Matita
Fare clic con il tasto sinistro del mouse sulla matita per modificare il nome del ritaglio.
Occhio
Fare clic con il tasto sinistro del mouse sull’occhio per modificare la visualizzazione del ritaglio.
Scarica freccia
Fare clic a sinistra per scaricare il ritaglio come nuvola di punti.
Bidone della spazzatura
Fare clic a sinistra e confermare per eliminare il ritaglio.
4. Clip
Ruotare
Fai clic a sinistra e tieni premuto su una linea curva. Scorri per ruotare la casella lungo quella linea curva.
Tradurre
Fai clic a sinistra e tieni premuto su una linea retta. Scorri per far scorrere la casella lungo quella linea.
Espandere
Fai clic a sinistra e tieni premuto su un punto elenco. Scorri per espandere la casella lungo quella linea di punti elenco.
Importazioni ed esportazioni 3D
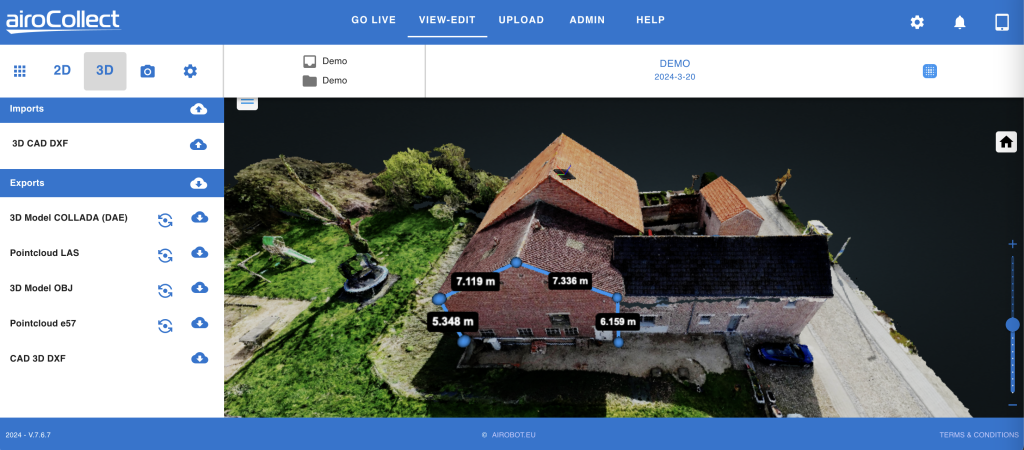
1. Importazioni
Carica un file CAD 3D georeferenziato come sovrapposizione del tuo modello di nuvola di punti.
2. Esportazioni
1. Il modello 3D in formato DAE per SketchUp.
2. La nuvola di punti in LAS con riferimento geografico.
3. Il modello 3D come punti in OBJ.
4. La nuvola di punti in e57.
5. Il CAD 3D DXF delle misurazioni effettuate.
– Questa opzione funziona solo se le misurazioni sono posizionate.
Solare
AiroCollect ha le seguenti opzioni di simulazione:
Simulazione del tetto solare
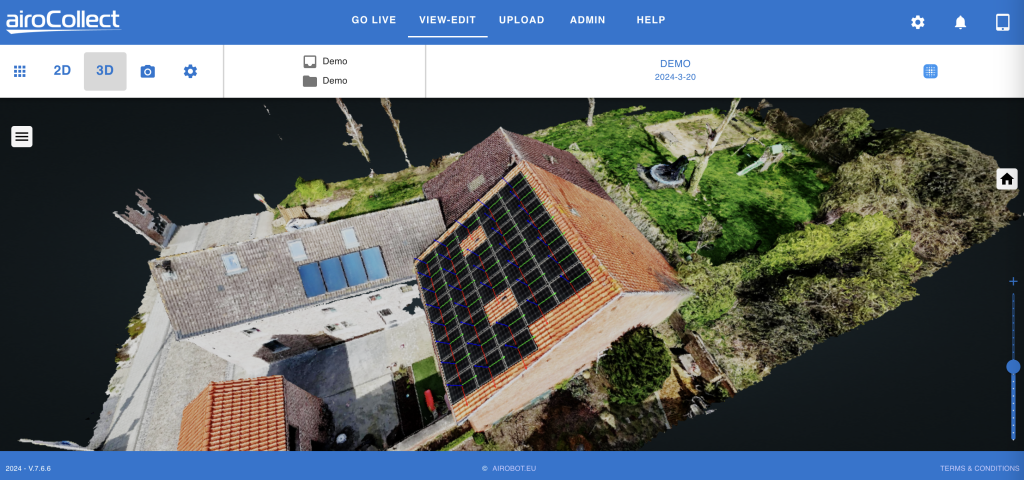
Generale
Lo strumento solare può essere utilizzato per ottenere rapidamente una stima di quanti e dove i pannelli solari possono essere posizionati su un tetto:
- Definire le dimensioni del pannello, la resa (Watt/pannello) e i parametri di spaziatura
- Seleziona l’orientamento del pannello, verticale o orizzontale
- Definisci il tipo di pannello, per il colore del report e la preparazione del lavoro
- Predisporre la superficie del tetto su cui posizionare i pannelli oppure posizionare solo alcuni pannelli singoli sul tetto.
- Posiziona un pannello su quella superficie e moltiplicalo automaticamente per riempire l’intero tetto
- Modificare (ruotare, far scorrere) l’intero set di pannelli e rimuovere singoli pannelli in cui vengono visualizzati ostacoli.
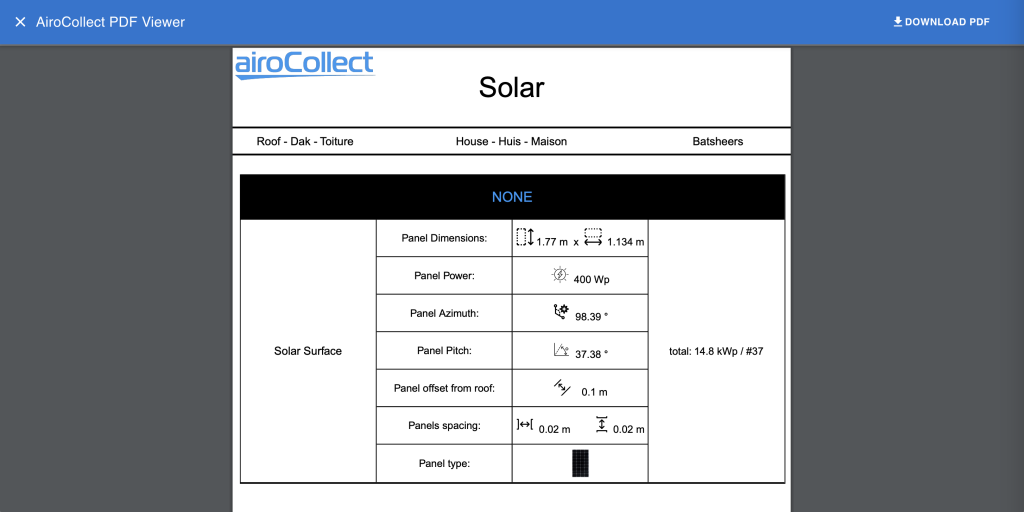
- Ottieni un risultato nel report dell’impianto solare e aggiungi una visualizzazione realistica per il tuo cliente.
Definire i parametri di posizionamento
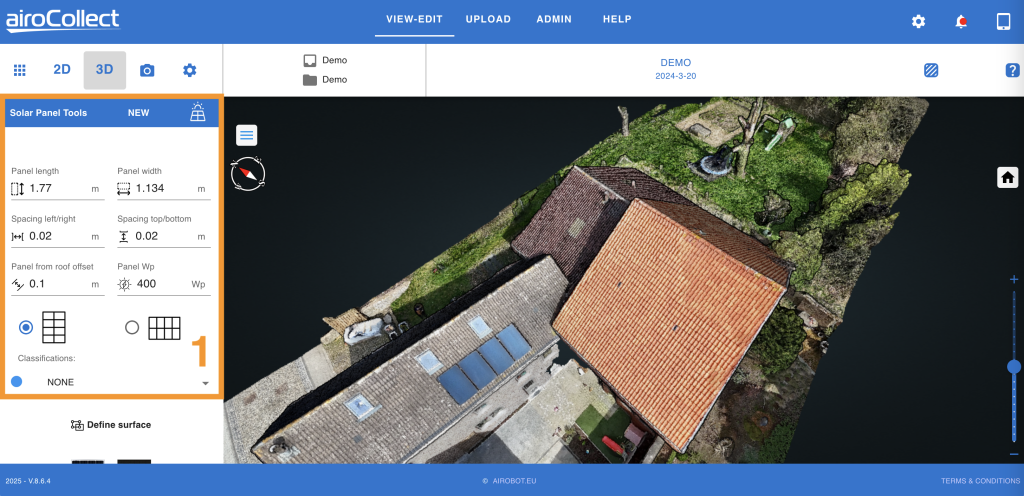
1. Parametri
- Regolare la lunghezza e la larghezza dei pannelli da posizionare
- Definire la spaziatura tra i pannelli
- Definire la distanza dai pannelli alla superficie
- Fornire un’indicazione della potenza di picco dei pannelli
- Imposta l’orientamento predefinito del pannello (verticale o orizzontale)
- Scegli un colore e una classificazione (ad esempio in caso di più tetti da allestire)
Continua qui sotto per iniziare il posizionamento del pannello.
Posiziona un pannello
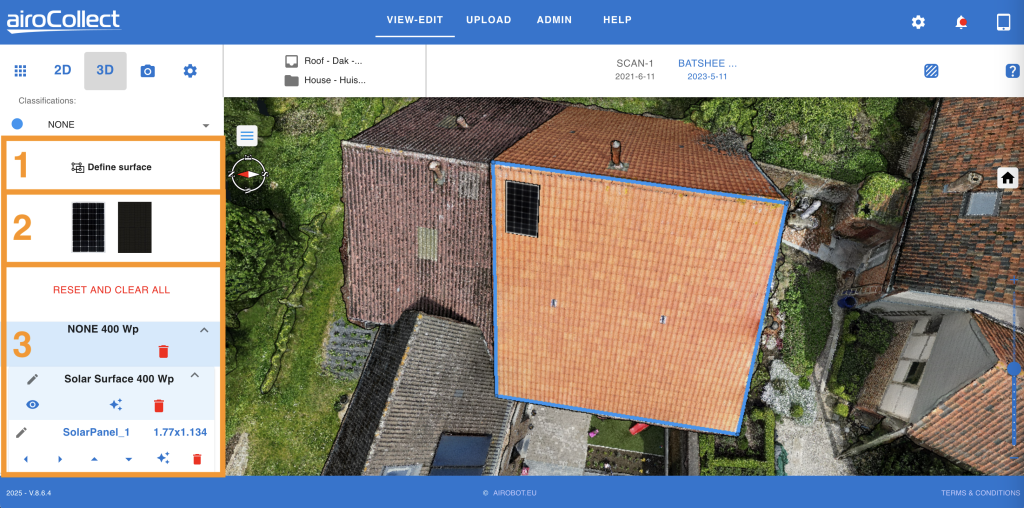
1. Definire la superficie
Puoi posizionare liberamente alcuni pannelli solari sul modello o decidere di posizionare una serie di pannelli solari in una superficie definita. Per posizionare liberamente un pannello, non definire una superficie, ma fai clic (1x a sinistra) su un pannello (2) e sposta il mouse sul modello 3D, fai clic (1x a sinistra) per ancorare il pannello in qualsiasi punto del modello.
- Per posizionare il pannello in una superficie predefinita, fare clic una volta a sinistra su “Definisci superficie” per avviare lo strumento di definizione dell’area
- Accedi al modello 3D e disegna un poligono sulla superficie del tetto su cui vuoi posizionare i pannelli.
- Fai clic una volta a sinistra per posizionare il primo punto e continua a fare clic a sinistra per aggiungere punti per definire le estremità della superficie. Fai doppio clic a sinistra per terminare il poligono.
- Una volta definita la superficie, fare clic una volta con il tasto sinistro su una delle 2 texture del pannello per posizionare il primo pannello sul modello 3D.
- Spostare il mouse all’interno del poligono definito e selezionare l’inizio della prima fila di pannelli solari da posizionare.
- Una volta soddisfatto del posizionamento, fare clic verso sinistra 1 volta per ancorare il pannello.
Fare clic con il tasto sinistro del mouse su “Reimposta e cancella tutto”, convalidare e ricominciare.
2. Posizionare il primo pannello
- Una volta definita la superficie, fare clic una volta con il tasto sinistro su una delle 2 texture del pannello per posizionare il primo pannello sul modello 3D.
- Spostare il mouse all’interno del poligono definito e selezionare l’inizio della prima fila di pannelli solari da posizionare.
- Una volta soddisfatto del posizionamento, fare clic verso sinistra 1 volta per ancorare il pannello.
- Fare clic 1 volta a sinistra sul pannello ancorato: appariranno alcuni archi e linee.
- Fare clic e tenere premute quelle linee per far scorrere o ruotare il pannello, per adattarlo meglio al poligono definito.
Fare clic con il tasto sinistro del mouse su “Reimposta e cancella tutto”, convalidare e ricominciare.
3. Riempire la superficie
- Fare clic una volta con il tasto sinistro del mouse sull’icona magica nell’intestazione della superficie solare.
- Il nostro software farà del suo meglio per riempire l’area completa.
- Se l’area non è completamente riempita, clicca a sinistra su un pannello sul bordo. Si illuminerà nel menu sul lato sinistro.
- Con le frecce puoi copiare il pannello nella direzione in cui vuoi espanderlo.
- Prendi il pannello espanso e clicca nuovamente sul pulsante magico per riempire ulteriormente l’area.
- Ora è possibile ruotare e far scorrere ogni singolo pannello nella direzione e nell’orientamento desiderati.
Fare clic con il tasto sinistro del mouse su “Reimposta e cancella tutto”, convalidare e ricominciare.
Sposta tutti i pannelli ed elimina quelli che sono ostruiti
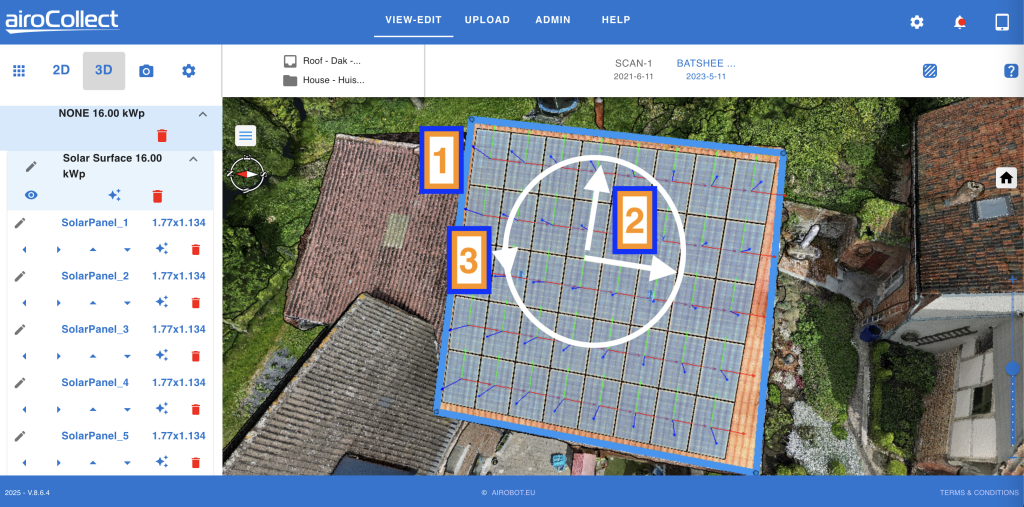
1. Selezionare il set completo di pannelli ed eliminare quelli indesiderati
- Fare clic una volta a sinistra sul poligono.
- Tutti i pannelli passano da normali a completamente trasparenti.
- Ingrandisci i pannelli per verificare se ci sono camini o altri elementi sul tetto che potrebbero impedirne il posizionamento.
- Clicca a sinistra sul pannello per selezionarlo e rimuoverlo dall’elenco sul lato sinistro. Dopo aver cliccato, l’elenco evidenzierà il pannello selezionato.
- Fare nuovamente clic sul poligono per rendere nuovamente traslucido l’intero pannello.
2. Spostare l'intero set in modo lineare
- Utilizzare le frecce sulla tastiera per spostare l’intero set di pannelli.
- Utilizzare i tasti freccia sinistra e destra per spostarsi orizzontalmente a piccoli passi all’interno della superficie definita.
- Utilizzare i tasti freccia su e giù per spostarsi verticalmente a piccoli passi all’interno della superficie definita.
3. Ruotare l'intero set in modo circolare
- Utilizzare e tenere premuto il tasto MAIUSC + TAB sulle frecce sulla tastiera per ruotare l’intero set di pannelli attorno al suo punto centrale.
- Premere i tasti Sinistra e Destra tenendo premuto il tasto MAIUSC per ruotare di alcuni gradi in ciascuna direzione.
- Provare a ruotare i pannelli in modo che le loro linee corrispondano alle tegole del tetto.
Crea un'immagine per il report
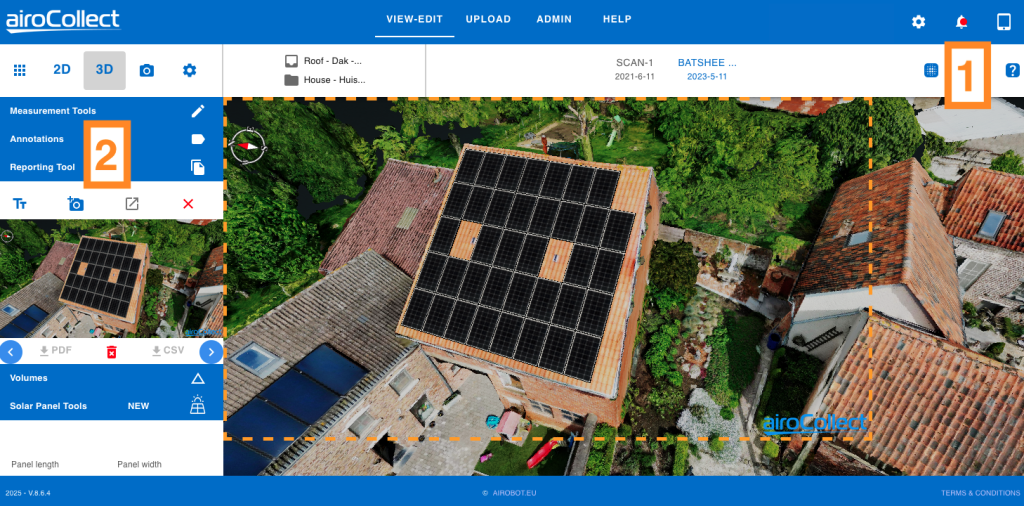
1. Modalità fotorealistica
- Il modello 3D può essere spostato in una vista di nuvola di punti (punti 3D) o in una rappresentazione mesh fotorealistica (texture 3D).
- Fare clic una volta con il tasto sinistro sull’icona per passare da una modalità di visualizzazione all’altra.
2. Crea un'immagine di come apparirà il risultato
- Aprire il menu “Strumento di segnalazione” (1 clic sinistro)
- Orientare la vista 3D in modo che rappresenti bene il risultato per il cliente.
- Premere l’icona della fotocamera+ per attivare la linea tratteggiata arancione su cui disporre l’istantanea da scattare.
- Premere nuovamente l’icona della fotocamera+ per scattare l’istantanea.
Utilizzare il 2D per ottenere l'azimut e un piano di posa
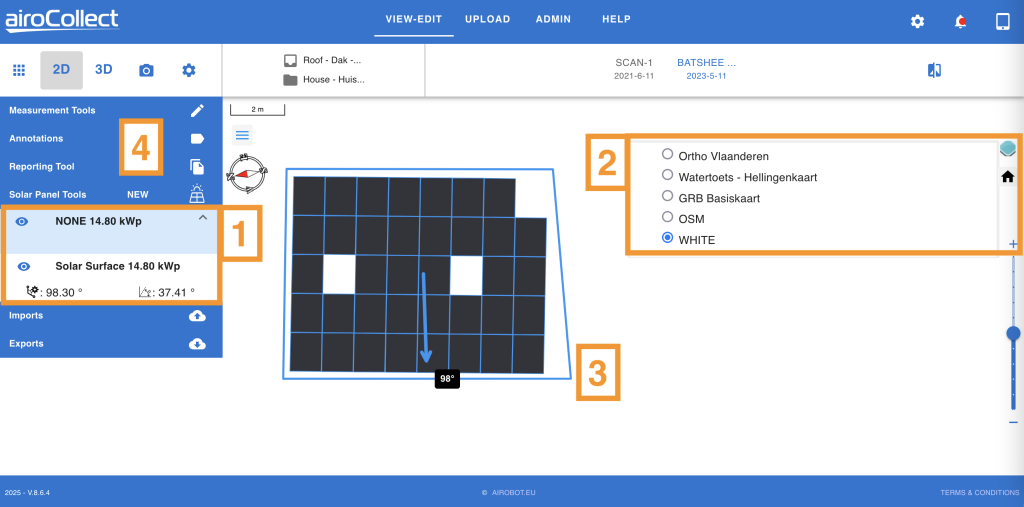
1. Vai su 2D e premi Strumenti pannello solare
- Qui troverai tutte le superfici dei pannelli solari che hai definito.
- Per ogni gruppo di pannelli si ottiene l’azimut da sud e l’angolazione.
2. Cambia il layout dell'immagine 2D
- Premi l’icona del livello per modificare ciò che viene visualizzato.
- Deselezionare la foto ortografica per nascondere l’immagine satellitare.
- Selezionare BIANCO per avere uno sfondo bianco.
3. Modificare la finestra di visualizzazione del report
- Tieni premuto il tasto MAIUSC e fai clic con il tasto sinistro del mouse tenendolo premuto per ruotare l’immagine mentre muovi il mouse.
- Utilizzare il pulsante di scorrimento per impostare il livello di zoom desiderato.
4. Aggiungere la planimetria al report
- Aprire il menu degli strumenti di reporting.
- Fare clic 1 volta a sinistra sull’icona della fotocamera+ per ottenere un contorno dell’immagine da aggiungere al report.
- Fare clic 1 volta con il tasto sinistro del mouse sull’icona della fotocamera+ per aggiungere il contorno selezionato come immagine al report.
Genera il report per ottenere tutte le informazioni dell'impianto solare
Progetto
Importa in CAD

Importa in Sketch Up 2022

Dal minuto 27


Ammin
All’interno di AiroCollect hai la possibilità di configurare il funzionamento dell’applicazione.
Panoramica
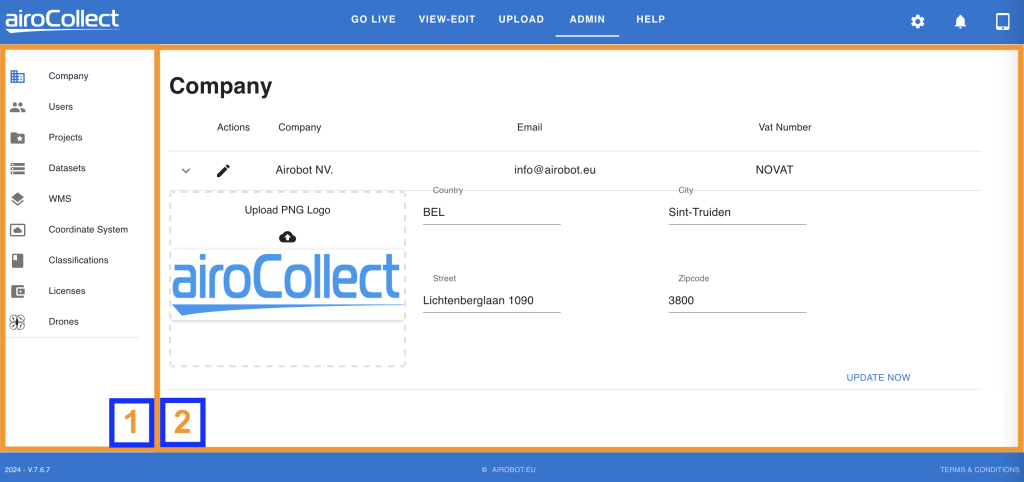
1. Menù
Azienda
Modificare il nome dell’azienda, il numero di partita IVA, il logo e l’indirizzo.
Questi dati verranno utilizzati nel report di ogni scansione.
Utenti
Aggiungere, modificare ed eliminare utenti.
Concedi agli utenti l’accesso al programma:
– Visualizza: vedi progetti
– Visualizza-Modifica: vedi e modifica progetti
– Carica: crea nuovi progetti
– Admin: gestisci la pagina di amministrazione e accedi completamente.
Concedi agli utenti l’accesso ai dati:
– Tutti o un set di progetti
– Tutti o un set di elementi
– Tutti o un set di set di dati
Progetti
– Gestire i dati relativi a nome, descrizione e posizione.
– Eliminare se necessario.
Set di dati
– Elenco di tutti i set di dati con opzione di eliminazione.
Servizio di mappatura Web (WMS)
– Aggiungere servizi WMS self-hosted o ospitati online alla panoramica delle foto ortografiche (2D).
– Essere in grado di confrontare il proprio modello con elementi del mondo reale.
Sistema di coordinate
Definire i sistemi di coordinate in cui devono essere gestiti i dati del mondo reale.
– Impostare lo standard per le coordinate non RTK e RTK sulle immagini dei droni
– Impostare lo standard per tutte le esportazioni di geodati.
Modificare il mondo delle misure tra METRICO e IMPERIALE.
Classificazioni
Definisci le etichette dei colori utilizzati durante la misurazione. Adattale a ciò che si adatta alla tua attività.
Licenze
Ottieni una panoramica della tua licenza AiroCollect.
Droni
Ottieni informazioni in tempo reale sui droni connessi da utilizzare con AiroCollect.
2. Modifica
Modifica le voci scelte dal menu.
Licenza
La licenza AiroCollect è una licenza singola.
Ti trovi in un sistema limitato (SMALL, MEDIUM) o in un sistema illimitato (UNLIMITED). Paghi questa licenza su base mensile o annuale.
Puoi sempre cambiare licenza, a seconda della formula che preferisci.
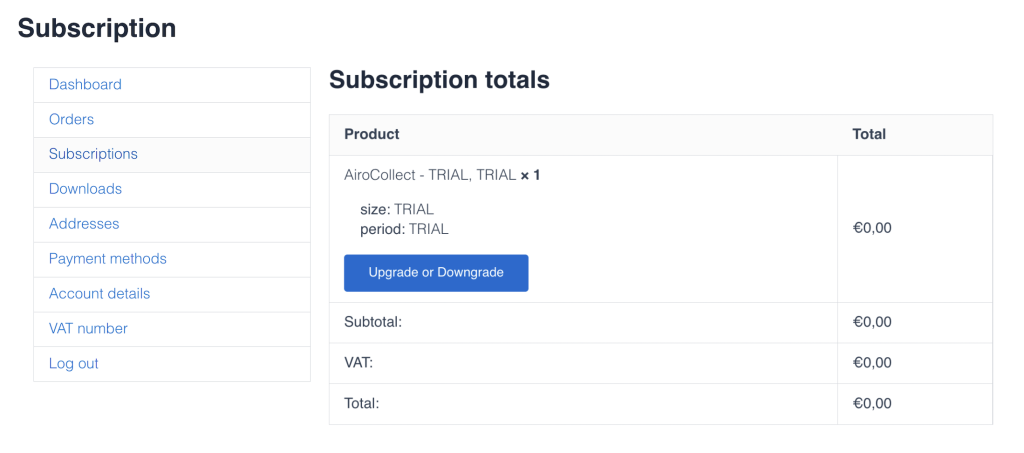
A) Per modificare il tuo abbonamento vai alla sezione abbonamenti.
1. Accedi al tuo account.
2. Fai clic su abbonamenti per visualizzare cosa hai in esecuzione con noi.
3. Fai clic sull’abbonamento che vuoi modificare.
4. Premi “Upgrade o Downgrade” per modificare la tua licenza.
B) Sono possibili le seguenti modifiche: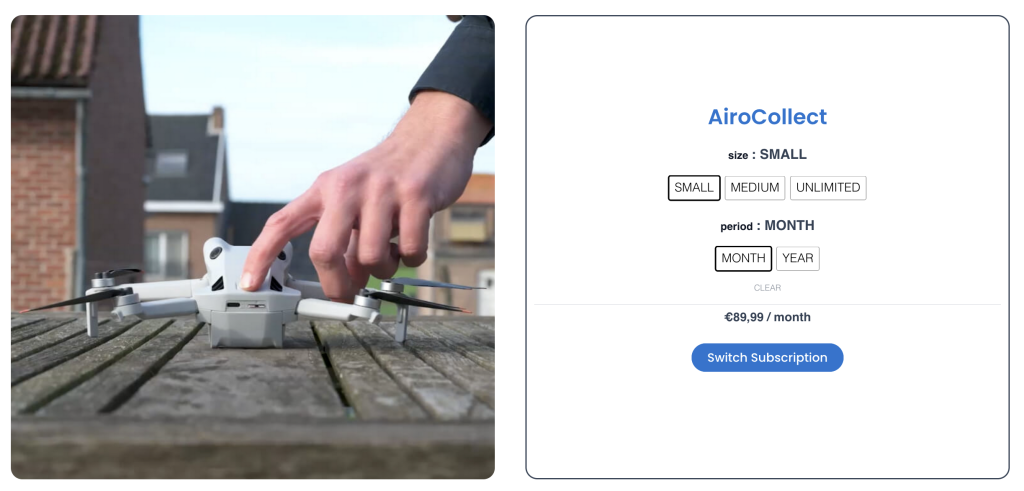
In base all’opzione scelta, la tua licenza verrà adattata automaticamente al nuovo abbonamento.
A) Per ricaricare il tuo abbonamento vai su subscriptions.
1. Accedi al tuo account.
2. Fai clic su abbonamenti per visualizzare cosa hai in esecuzione con noi.
3. Fai clic sull’abbonamento che vuoi modificare.
4. Premi “Upgrade o Downgrade” per modificare la tua licenza.

B) Sono possibili le seguenti modifiche:
In base all’opzione scelta, la tua licenza verrà adattata automaticamente al nuovo abbonamento.
Pagamento
Il pagamento può essere effettuato direttamente sugli ordini o gestito in via generale.
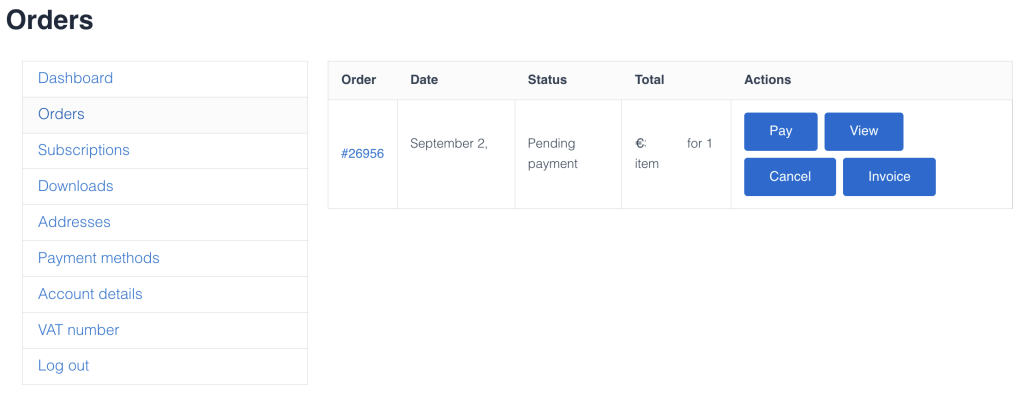
A) Pagamento dell’ordine, vai agli ordini (clicca sul link).
- Accedi al tuo account
- Clicca su “Ordini” per vedere la cronologia dei tuoi ordini
- Clicca su “Paga” per evadere l’ordine
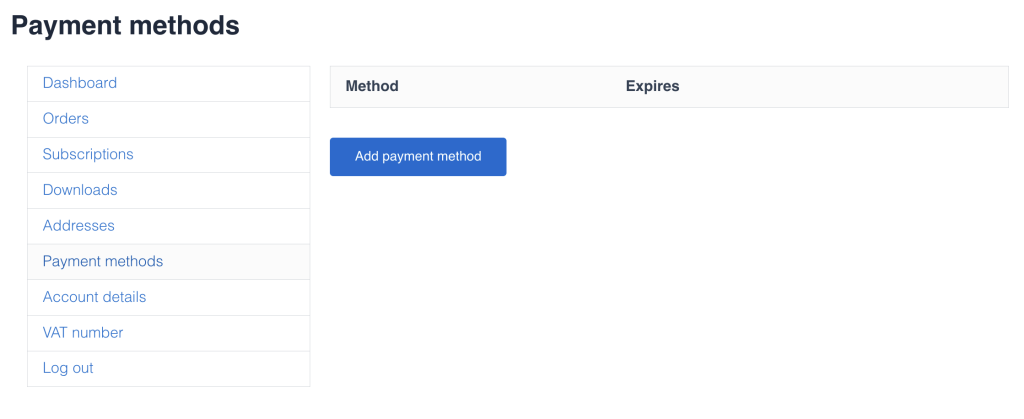
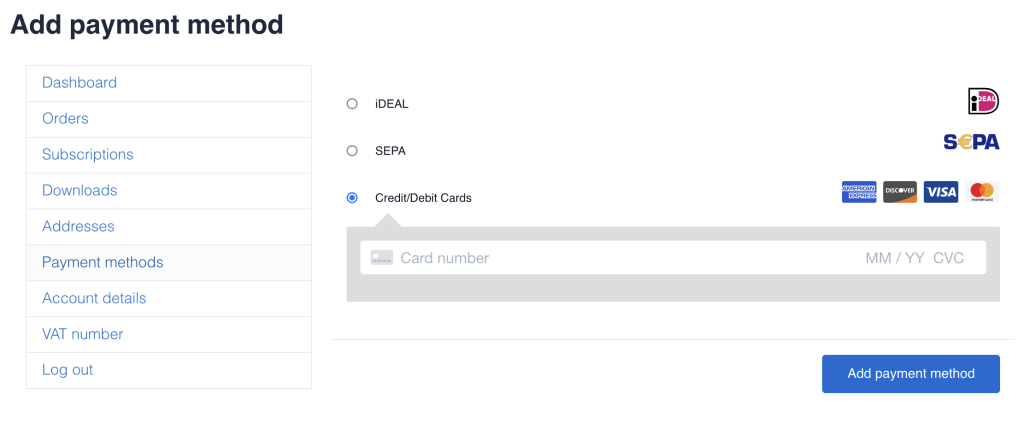
B) Per aggiungere o modificare il metodo di pagamento, vai a metodi di pagamento (clicca sul link).
- Accedi al tuo account
- Clicca su “Metodi di pagamento” per vedere le tue impostazioni
- Clicca su “Aggiungi metodo di pagamento” per gestire
Fattura
Per recuperare la tua fattura vai alla sezione ordini.

- Accedi al tuo account
- Clicca su “Ordini” per vedere la cronologia dei tuoi ordini
- Fare clic sulla fattura dall’ordine in cui si desidera ottenere la fattura
Scaricamento
Fare clic sull’icona qui sopra per installare direttamente l’applicazione o per collegarsi ad essa.
ATTENZIONE: funziona solo per il telecomando con smartphone Android!
Acquista da DJI: DJI STORE
Per MINI-1,2 e 3 o 4 vai su airocollect.com/android per le istruzioni di installazione e le note di rilascio.
Per I-Phone vai su airocollect.com/dji per le istruzioni su come volare in automatico.
Le applicazioni sono realizzate per semplificare la scansione di un’area con un drone!
Sono tutti gratuiti.
(anche altri droni DJI possono funzionare ma non sono supportati)
- MINI-1 + MINI-1 SE
- MINI-2 (non MINI-2 SE; non MINI-4K)
- MINI-3 + MINI-3 PRO
- MINI-4 + MINI-4 PRO
(anche altri dispositivi Android possono funzionare, ma non sono supportati)
- Android 10-11-12-13-14
- Compatible with: Samsung Galaxy S24 Ultra, Samsung Galaxy S23 Ultra, Samsung Galaxy S22 Ultra, Samsung Galaxy S21 Ultra, Samsung Galaxy Note 20 Ultra, Samsung Galaxy A54, Samsung Galaxy A53, HUAWEI Mate X5, HUAWEI Mate 70 Pro, HUAWEI Mate 70, HUAWEI Mate 60 Pro, HUAWEI Mate 60, HUAWEI Mate 50 Pro, HUAWEI Pura 70 pro+, HUAWEI Pura 70 pro, HUAWEI Pura 70, HUAWEI P60 pro, HUAWEI P50 pro, Xiaomi 15 Pro, Xiaomi 14 Pro, Xiaomi 13 Ultra, Xiaomi 12 Ultra, Xiaomi 11 Ultra, Xiaomi MIX 4, Xiaomi POCO X5 Pro, Redmi Note 12 Pro, Redmi Note 11 Pro, Redmi K60 Pro, Redmi 12C, HUAWEI nova11 Pro, Honor 90 Pro, OPPO Reno 10 Pro, VIVO X200 Pro, VIVO X100 Pro, VIVO S17 Pro, VIVO Y78+, iQOO neo8, OnePlus Nord CE 3, Pixel 9 Pro, Pixel 8 Pro, Motorola G24, Motorola G32.
Suggerimenti e Trucchi
Qui forniamo feedback su come ottimizzare il processo. A seconda di ciò che si desidera recuperare da una scansione, la qualità del risultato a volte risiede nei dettagli dell’operazione.
Di seguito puoi trovare alcune domande che abbiamo ricevuto:
Il modello non ha facciate
Il motivo per cui le facciate talvolta non sono visibili è dovuto alla mancanza di immagini scattate.
Il caricamento non riesce
Quando aggiungi le tue immagini in AiroCollect, le migliori pratiche sono:
- Avere una connessione Internet stabile.
- Carica le immagini dal disco rigido del tuo computer e non dal drone.
- Non chiudere la finestra di caricamento della schermata del browser.
- Non lasciare che il computer entri in modalità di sospensione.
Se uno dei precedenti non è presente, riprova a correggerlo.
Le misurazioni non sono accurate
Superfici oblique
Se devi misurare superfici inclinate assicurati di lavorare in un ambiente 3D. L’ambiente 2D è utile solo per misurare piani perfettamente orizzontali.
La scansione non ha seguito un metodo di volo standard
– solo poche immagini
– diversi angoli del gimbal durante la scansione
– immagini scattate a diverse altezze
– voli in orari diversi durante la giornata
Si consiglia di utilizzare la “Barra della scala” per impostare una misura di riferimento nota.
L'app Android non si connette al drone
- Il drone e il telecomando sono accesi?
- Hai rimosso dalla memoria un’altra app come DJI che potrebbe connettersi al drone?
- Hai installato l’app giusta per il tuo drone?
- Il tuo telefono è compatibile con l’applicazione Android?
Non riesco a disegnare un piano di missione
1. Il drone ha una posizione GPS?
Il drone non decollerà
- Il tuo drone ha la posizione GPS?
- La batteria del tuo drone e del telecomando è sufficientemente carica?
- Il tuo drone richiede una sorta di calibrazione (compas, IMU)?
- Sul tuo drone è installato l’ultimo firmware?


